
Troubleshoot Faster with
a Kubernetes Debug Session
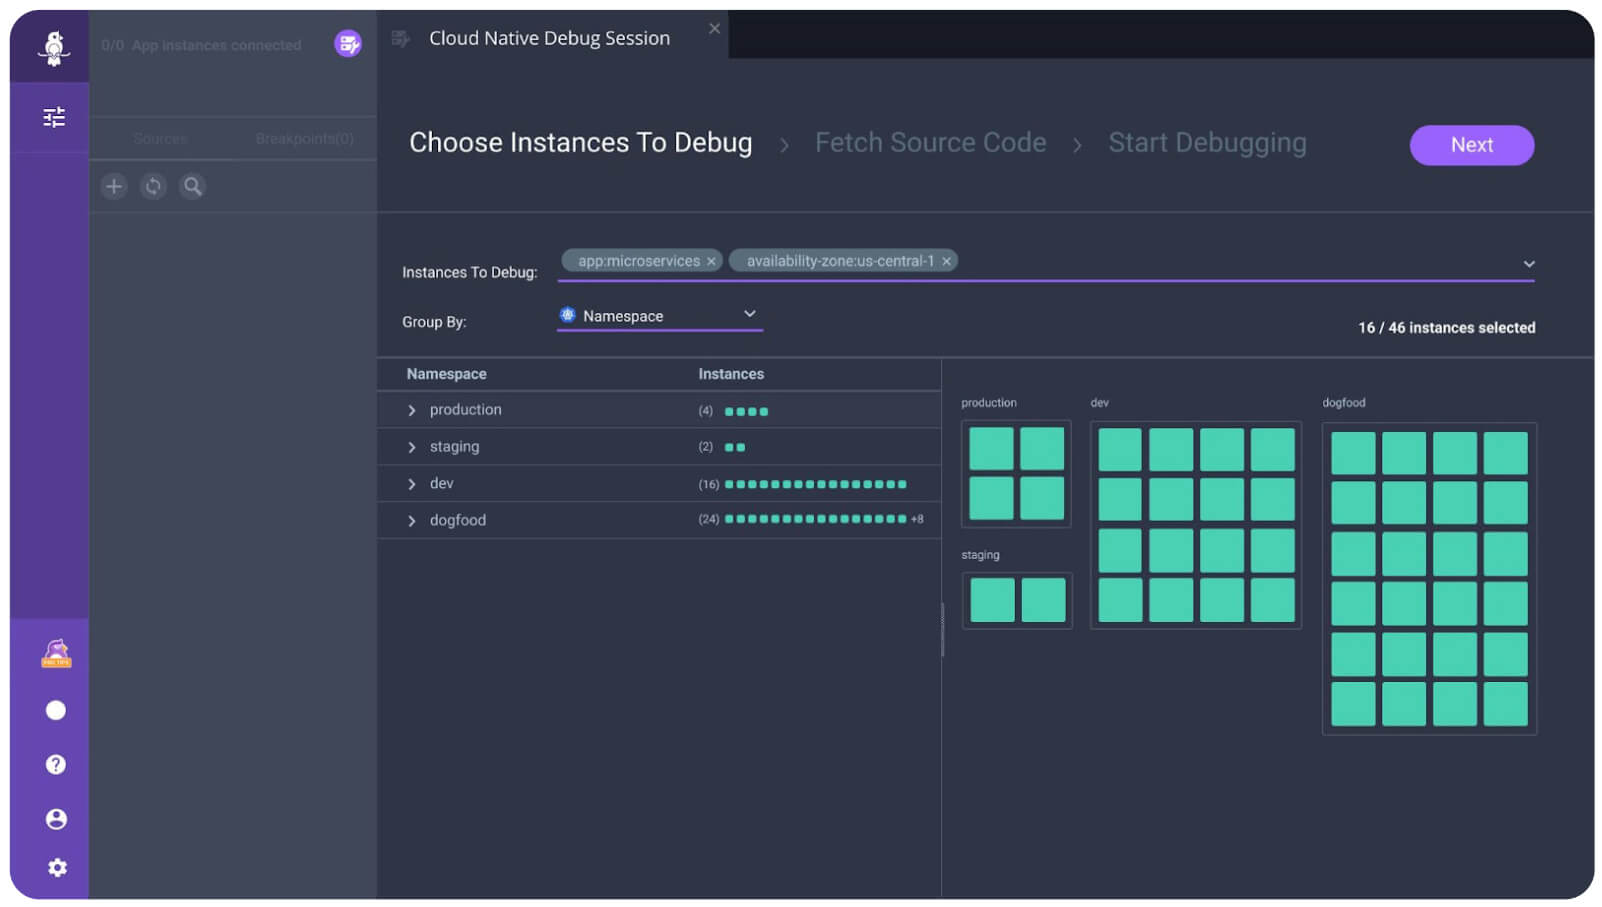
Slice and Dice a Kubernetes application within a Rookout session
Debug multiple instances simultaneously
Identify clusters that require your immediate debugging attention
Visualize your application mapping with a click of a button
Seamlessly work with your preferred engine
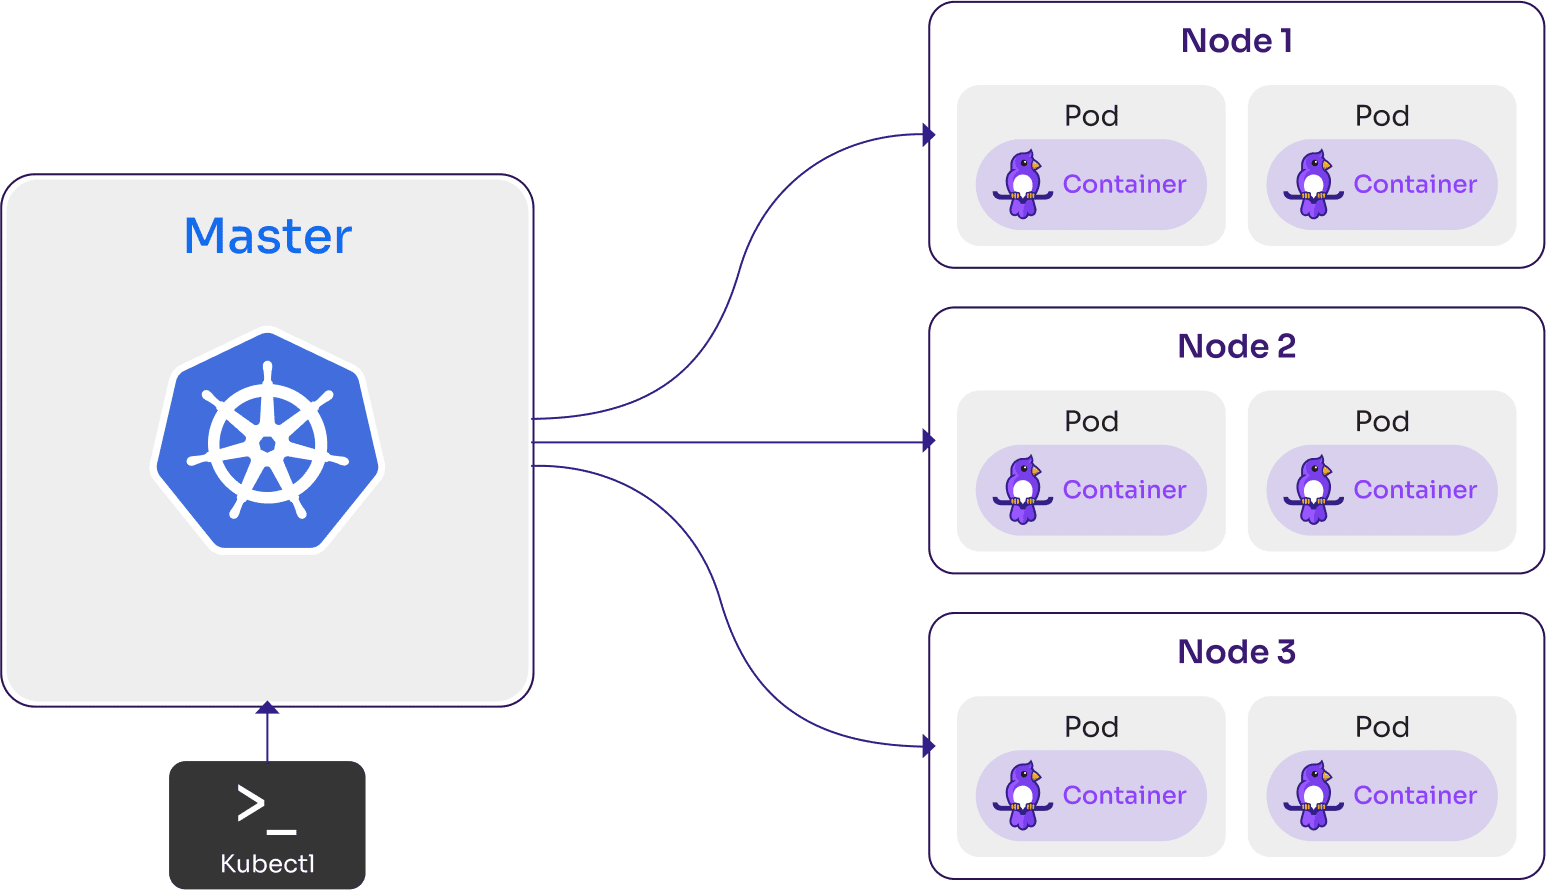
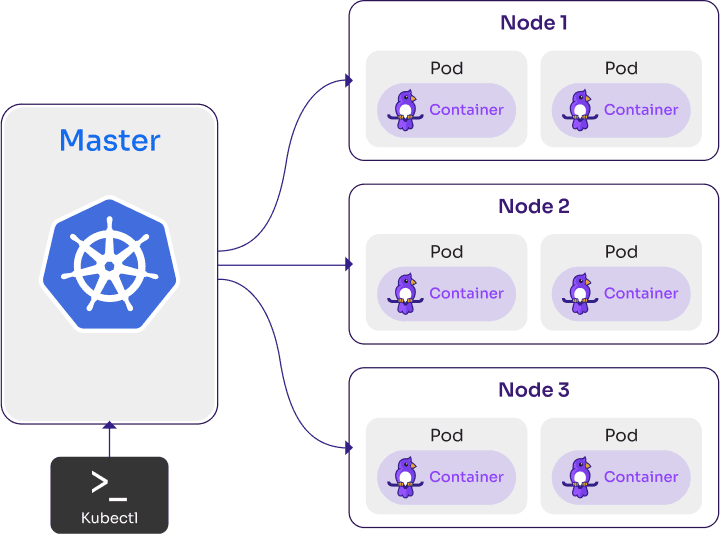
- Rookout’s SDK is configured at the code level and runs within your container in your Kubernetes cluster.
- No need for additional configuration to your Kubernetes cluster as Rookout is configured at build time.
It’s as easy as clicking a button
1
Select pods to debug
2
Place a non-breaking breakpoint
3
Get real-time debug data