Level Up Your Cloud-Native Debugging Experience

Debugging is hard. Cloud-native debugging is even harder. Debugging Kubernetes and Serverless applications sometimes feels nearly impossible when:
- Debugging code running remotely, dynamically, and sometimes completely in virtual environments
- Making sense of a rapidly changing code base, most of which has been written by someone else
- Experiencing a long and complex deployment process that makes pushing changes and log lines long and cumbersome
These classic remote debugging challenges have made the world of cloud debugging seem impossible at times and has given rise to the practice of Observability.
The rise of the Observability trend in recent years has directed engineers towards one direction to solving these problems: print logs, print traces, throw exceptions. Collect the above data points in a centralized monitoring and visualization tool and use them to troubleshoot. And then, when a new problem arises that requires printing new logs, traces, and errors? Just add code.
Cloud-Native Debugging & Observability
That last comment about adding code has emphasized a key challenge in Cloud-Native debugging: the need to wait for new data to come to light. Live Debugging tools and Live Observability practices have added a new edge to the Observability domain in the past three years or so. Here at Rookout, we have been providing our customers with Live Debugging capabilities, allowing them to debug Kubernetes and Serverless applications in production and staging for a while now.
And, as trailblazers, we have seen our customers face new challenges as they’ve been using our cutting edge solution to debug their Cloud-Native production environments.
We have seen our customers struggle to reproduce issues locally, predominantly in cases where it’s very hard to recreate a copy of a remote environment while simulating the scale, complexity, network conditions, and data state in the live app.
Some of our customers have adopted tools like Tilt, Garden, and Skaffold to simplify and automate this flow. Other customers have taken the opposite approach, opting to gain visibility into the remote environment within a speed and user experience that is as close as possible to the local debugging experience, using tools like Telepresence and Okteto.
We see our customers working hard to manage an ever growing tech stack. The number of programming languages, cloud management frameworks, and the sheer magnitude of tools and code lines that make up their observability pipeline is its own challenge.
Along with the growing scale of the tech stack, the volume of data is growing as well. Managing code version changes, configuration changes, variable state, stack trace, and other data points that need to be thrown together to make sense out of the application behavior is a serious undertaking. Fetching log lines, debug snapshots, error messages, and traces from a running app, shipping the data into a centralized pipeline, and creating the relevant dashboards and alerts on top of the collected insight requires a specialized set of tools and skills.
Visual Debugging Sessions
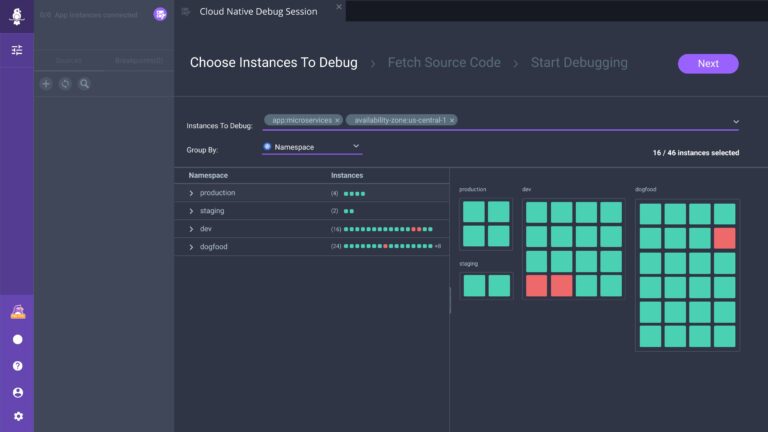
A key demand we have heard from our customers when trying to tackle the above challenges is a deep need for visualization. Having the ability to dynamically generate new log lines and debug snapshots and metrics has been the bread and butter of Live Debugging tools like Rookout since the inception of our first product launch. But having the ability to collect said data points and present them in the right context, all while providing a visual representation of the state of the application and giving a clear and intuitive way to slice and dice data based on the architecture of the application, takes Live Debugging to the next level.
This is where the concept of a visual debug session was born. We wanted to help software engineers make sense out of the growing complexity of debugging cloud-native applications. So, on top of the basic ability to deploy the Rookout agent in Kubernetes and Serverless environments (which has been around for a few years now), we now show the same environments in a way that provides deeper insight. By visualizing the state, scale, and clustering of the application, as well as allowing our users to slice and dice and prioritize problematic clusters and pods with the click of a button, we aim to make the cloud debugging experience something that is as easy and intuitive as, well, local debugging of a single app running on your desktop.
Go SDK
To wrap it all up, and to be able to tell a true “Kubernetes Debugging” story – we’re also launching a brand new Go SDK. As we know that Go is the go-to language for developing Kubernetes apps (pun intended), we realized that it was just a matter of time before we added the ability to debug Go apps using Rookout. In fact, it helps us wrap up our “eating our own dogfood” story, as we’ve been using an internal version of the Go SDK when debugging Rookout itself for a while now.
So if debugging cloud-native applications is still a challenge for you and your team, we hope things will be much easier now. We expect the new and visual Cloud-Native Debug Session, with its focus on making Kubernetes a first-class citizen at Rookout, and the newly added support for Go, will make your cloud troubleshooting much more effective.
-Happy Debugging-


